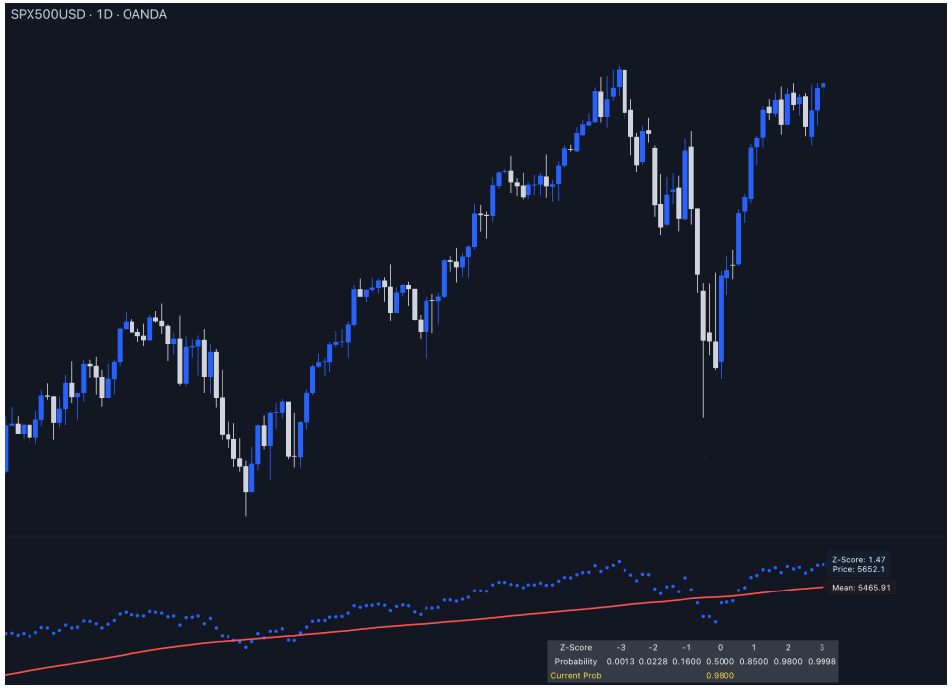
The Z-Score Directional Analysis evaluates how far the current price deviates from its average price over a set period. It uses the Z-score and the mean (average) to assess whether the price is significantly high or low compared to its historical trend. It can help in identifying potential overbought or oversold conditions.
What is the Z-Score and How is It Calculated?
The Z-score describes how far a particular data point is from the average, measured in standard deviations. In simpler terms, it tells you how unusual a current price is compared to its historical prices. A positive Z-score means the price is above average, while a negative Z-score means it's below average.
The Z-Score Formula:
Z-score=Current Price−Mean / Standard Deviation
- Current Price: The latest closing price of the asset.
- Mean: The average price over a set period (in this case, 75 periods by default).
- Standard Deviation: A measure of how spread out the prices are from the mean. A high standard deviation means prices have been more volatile, while a low standard deviation indicates they’ve stayed close to the average.
What is the Mean and How Does It Work with the Z-Score?
The mean, also known as the average, is calculated by adding up all the closing prices over the lookback period and then dividing by the number of periods. It represents the central point of the price data, acting as a benchmark to compare individual price levels.
The Z-score then uses the mean to determine how far current prices deviate from this central value. If a price has a high positive Z-score, it means it's much higher than average, which could indicate that the asset is overbought. Conversely, a high negative Z-score suggests the price is significantly below average, which could signal that the asset is oversold.
How the Refined Time-Series Analysis Indicator Works
- Z-Score Calculation: The indicator first calculates the mean and the standard deviation of the closing prices over the specified lookback period (default is 75 periods). It then calculates the Z-score by comparing the current price against these statistical benchmarks.
- Reflected Z-Score as a Price Level: The Z-score is then transformed into a price level, called the "Reflected Z-Score," by adjusting the mean with the standard deviation multiplied by the Z-score. This value helps visualize where the Z-score stands in terms of actual price, making it easier to relate to trading decisions.
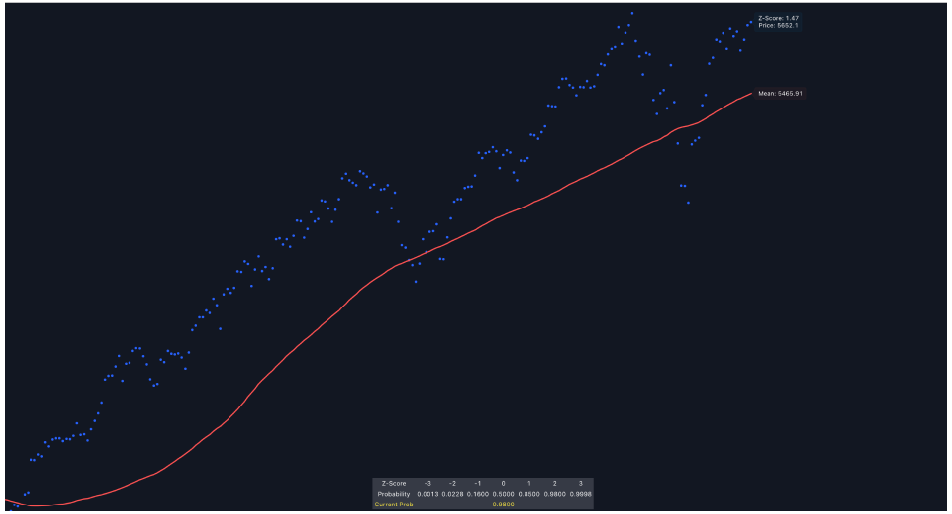
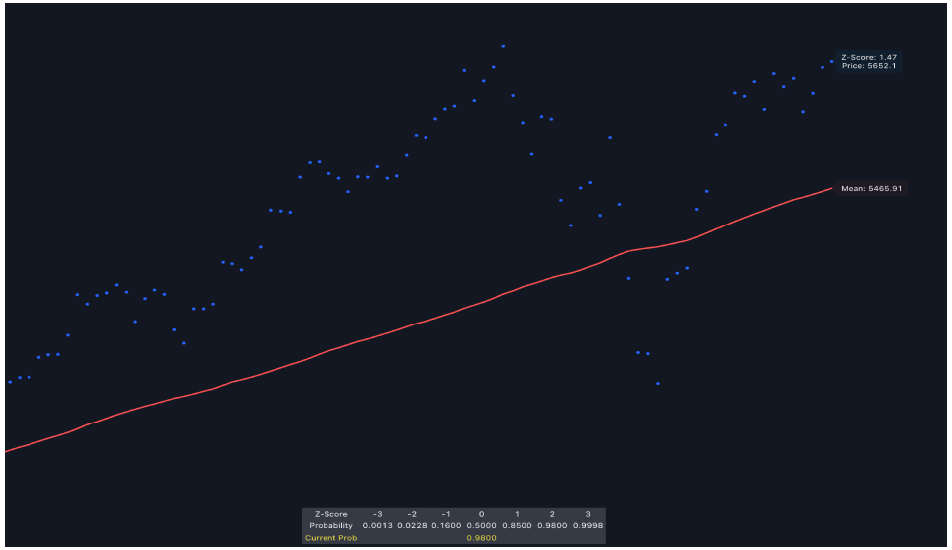
- Plotting the Lines: The indicator plots two lines on the chart—the Reflected Z-Score Dotted Line (in blue) and the Mean Line (in red). These lines show where the current price sits relative to its historical average and how extreme this level is, based on the Z-score.
- Displaying Labels and Z-Table: The indicator dynamically updates labels showing the current Z-score and mean values, along with a Z-Table that provides probabilities corresponding to various Z-score levels. This table helps interpret the Z-score by indicating how likely it is for prices to be at those levels, making it easier to judge whether the current price is statistically significant.
How to Use the Z-Score Directional Analysis Indicator
- A Z-score above 2 suggests that the price is higher than usual, which could indicate an overbought market and a potential sell signal. Similarly, a Z-score below -2 suggests an oversold condition and a possible buying opportunity.
- The Mean Line helps you quickly identify where the price generally sits over time. Prices consistently above the mean may indicate a strong uptrend, while prices below the mean may suggest a downtrend.
- Use the Reflected Z-Score line to gauge when the price is moving too far away from the mean. If the price is approaching this line from below, it could signal a potential exit point in a bearish trend. Conversely, if the price crosses above, it could confirm continued bullish momentum.
- The Z-Table shows the probability of the Z-score being at certain levels. For example, a Z-score of 3 or higher has a probability of just 0.13%, indicating an extremely rare event that could signal a reversal.
Z-Score Directional Analysis


