The Tiny Oracle is designed to help a trader make informed decisions by analyzing various technical indicators and market signals. It provides a comprehensive overview of market conditions using metrics like Alpha, Beta, and Z-Score, alongside a range of oscillators and moving averages. This tool offers can offer valuable insights into potential buy, sell, or neutral opportunities based on the current market trends.
Key Features of The Tiny Oracle
Alpha, Beta, and Z-Score Calculations
One of the core functions of The Tiny Oracle is its ability to calculate Alpha, Beta, and Z-Score values, which are great for assessing the performance and volatility of a stock relative to the market.
- Alpha (α): This metric measures the stock’s performance against a benchmark (e.g., S&P 500). It shows if a stock is performing better or worse than expected, considering its risk level. A positive Alpha suggests the stock is outperforming the market, while a negative Alpha indicates underperformance.
- Beta (β): Beta measures how volatile a stock is compared to the overall market. A Beta of 1 means the stock’s volatility matches the market. A Beta greater than 1 indicates higher volatility, meaning the stock’s price swings more than the market. If Beta is less than 1, the stock is less volatile.
- Z-Score: This value tells you how far the current stock price is from its average in terms of standard deviations. A high positive Z-Score means the stock is significantly above its average, while a negative Z-Score suggests it’s below its average.
How It Works
The Tiny Oracle uses these calculations to determine the overall market sentiment. For each metric, it assigns a label—Buy, Sell, or Neutral—based on the values of Alpha, Beta, and Z-Score. For example, if Alpha is positive, the indicator signals a Buy; if it’s negative, it signals a Sell.
Detailed Indicator Calculations
- Oscillators: The Tiny Oracle incorporates various oscillators such as RSI (Relative Strength Index), Stochastic Oscillator, CCI (Commodity Channel Index), ADX (Average Directional Index), Awesome Oscillator, Momentum, MACD (Moving Average Convergence Divergence), and Williams %R. These oscillators help assess market momentum and potential overbought or oversold conditions.
- RSI: Measures the speed and change of price movements. A reading below 30 indicates oversold conditions (Buy), and above 70 suggests overbought conditions (Sell).
- Stochastic Oscillator: Indicates overbought or oversold levels based on recent price movements.
- CCI: Helps identify cyclical trends in a stock’s price. A CCI below -100 indicates an oversold condition, while a CCI above 100 indicates an overbought condition.
- ADX and DI lines: These measure the strength of a trend, providing signals based on whether the trend is strengthening or weakening.
- Moving Averages: The Tiny Oracle also uses the EMA (Exponential Moving Average) and SMA (Simple Moving Average) with different time lengths (5, 10, 20, 50, 100, and 200 periods). These averages help smooth out price data to identify the overall trend direction.
-
- If the current price is above a moving average, it’s considered a bullish (Buy) signal. If it’s below, it’s a bearish (Sell) signal.
Combining Signals for a Comprehensive Market Overview
The Tiny Oracle takes into account the signals from the oscillators and moving averages to create an overall Buy or Sell score. This combined approach gives a more reliable view of the market, balancing multiple perspectives to reduce the risk of false signals.
Interactive Table Display
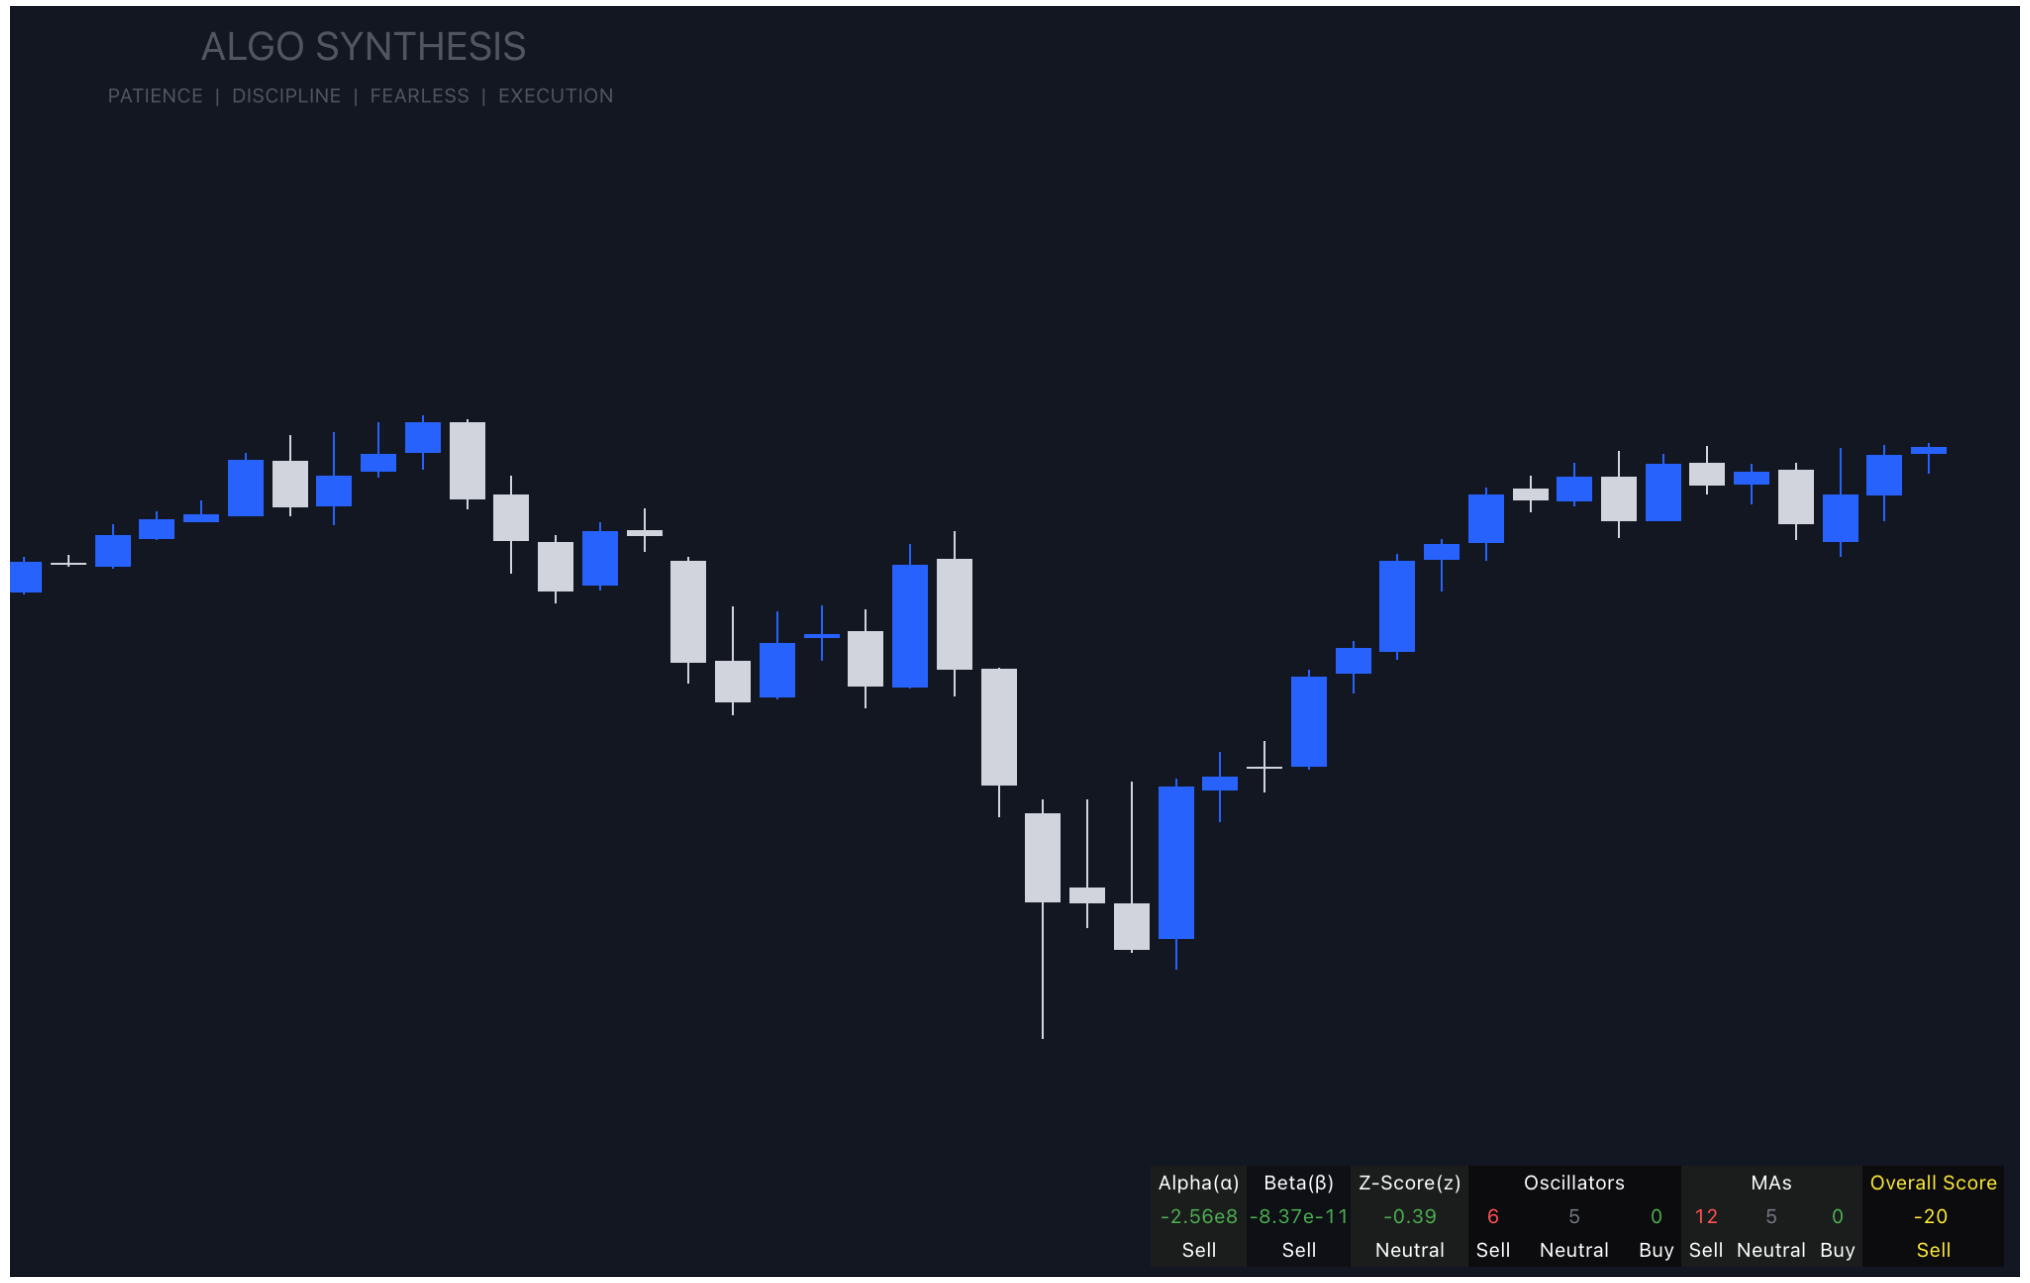
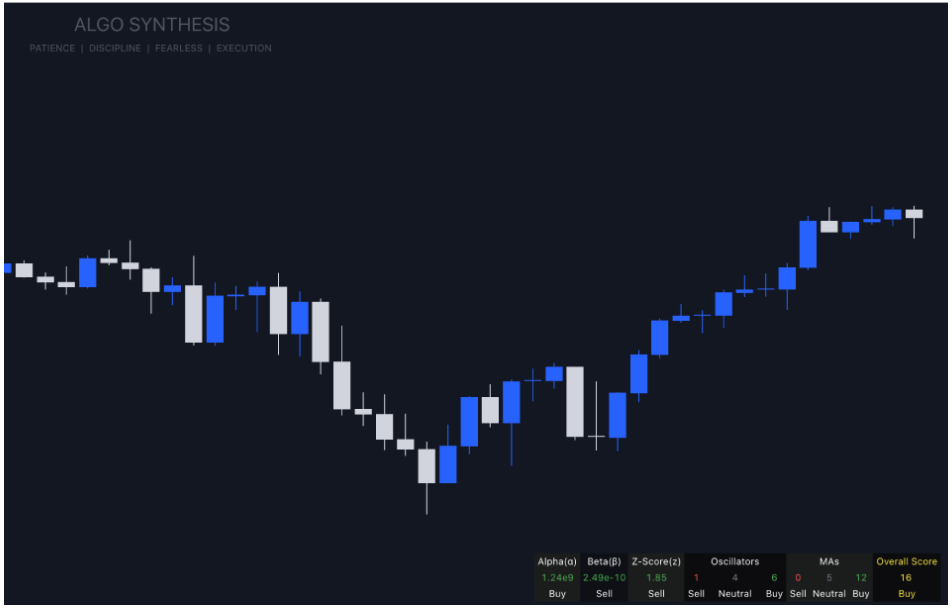
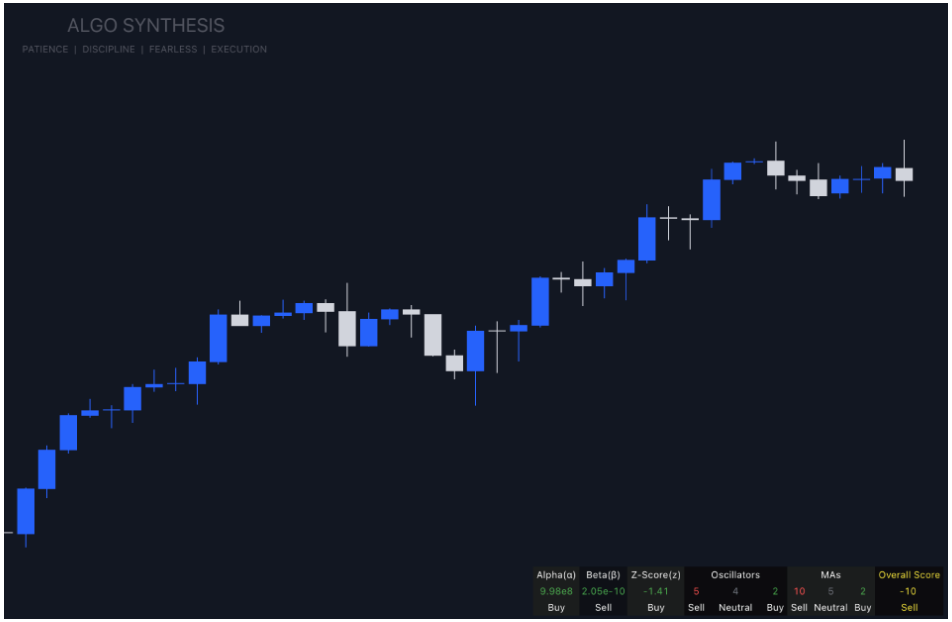
To make things easy to interpret, The Tiny Oracle displays all the data in a neatly formatted table. This table shows the Alpha, Beta, and Z-Score values alongside their respective Buy, Sell, or Neutral readings. It also includes the summed results from the oscillators and moving averages, providing a clear snapshot of the overall market sentiment.
It’s especially useful for understanding not just whether to buy or sell, but why. By showing how different indicators interact.
The Tiny Oracle GitHub Link


