

Understanding Autocorrelation and the Autocorrelation Strength Analysis Indicator (ASA)
Before explaining how the Autocorrelation Strength Analysis Indicator works, it's important to know a couple of key ideas: the Efficient Market Hypothesis (EMH) and the Random Walk Theory (RWH).
Efficient Market Hypothesis (EMH)
The EMH says that all available information is reflected in stock prices almost instantly. This means it's nearly impossible for traders to consistently beat the market because prices already adjust as soon as new information comes out. Others argue that this theory ignores the human side of trading and the imperfections of the market, but it does highlight how quickly markets process information. Basically, by the time most investors react to news, prices have already changed.
Random Walk Theory (RWH)
Building on the EMH, the RWH suggests that stock prices move so efficiently that they look random. This randomness makes it hard to predict future prices based on past data, implying that consistently making profits by forecasting price movements is extremely difficult, if not impossible.
What These Theories Mean
Together, these theories lead to a few key points:
Given these ideas, there are generally two main ways to try and profit in the market:
Using Autocorrelation to Spot Price Anomalies
Autocorrelation is a tool that helps spot these price anomalies by comparing how a variable (like a stock price) relates to its past values. For instance, if you're analyzing a stock's high prices, you'd compare today's high with highs from previous days. If the EMH and RWH are correct, these autocorrelations should average out to zero, showing randomness and market efficiency.
But if autocorrelation values are consistently high (above 0.5) or low (below -0.5), it suggests a pattern that isn’t random. This could point to inefficiencies in the market, which you may be able to exploit.
How the Autocorrelation Strength Analysis Indicator Works
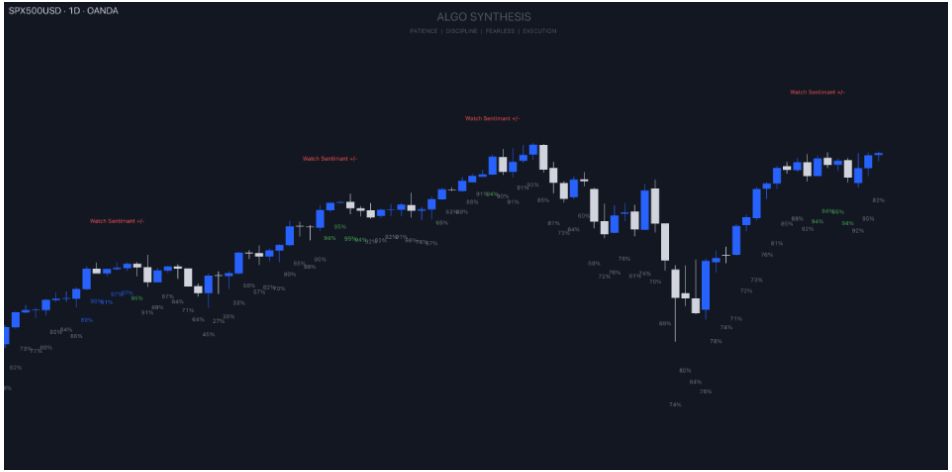
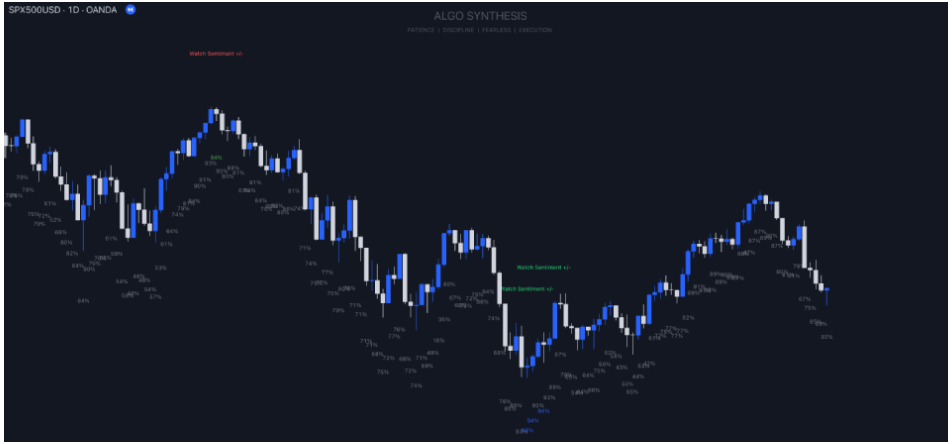
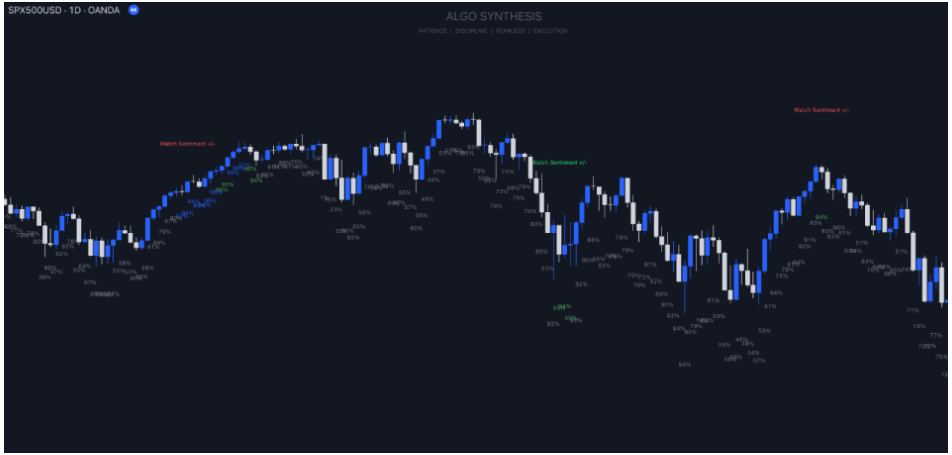
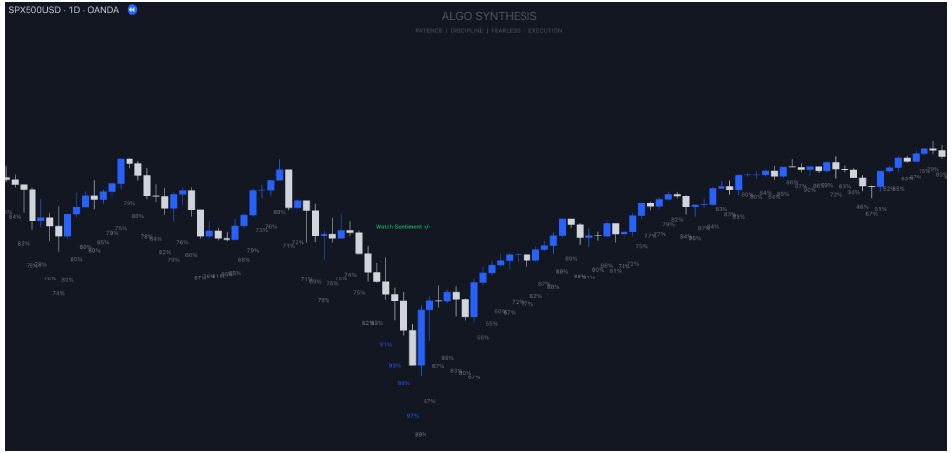
The ASA Indicator uses autocorrelation to find these market inefficiencies. Here’s how: