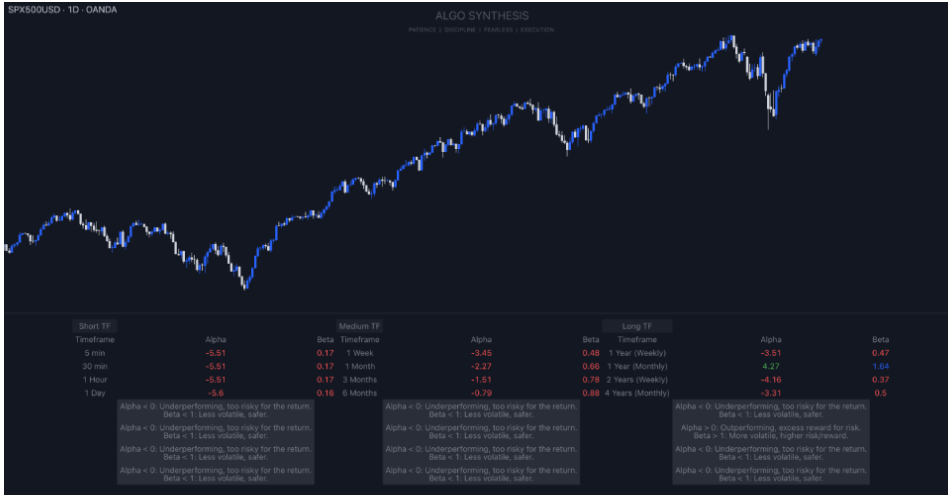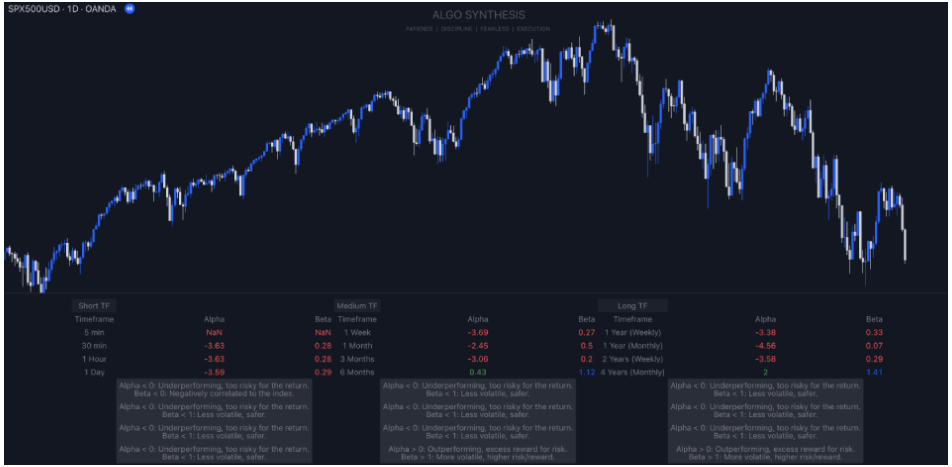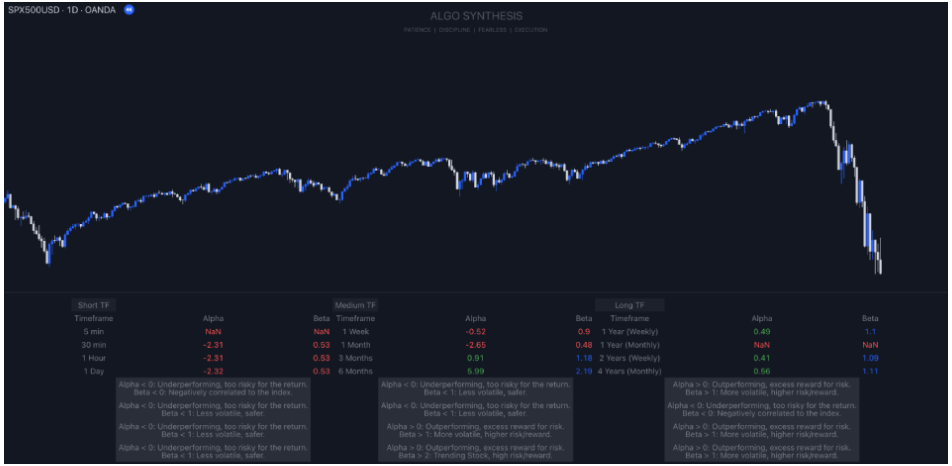


Understanding Alpha (α) and Beta (β) in Simple Terms
What is Alpha (α)?
Alpha (α) is a way to measure how well a stock is doing compared to the overall market, like the S&P 500. It tells you if a stock is performing better or worse than expected, based on its risk. If a stock has a high Alpha, it means it's outperforming the market after considering its risk level.
Formula for Alpha (α):
α = Ri - [Rf + β(Rm - Rf)]
What is Beta (β)?
Beta (β) measures how much a stock's price moves in comparison to the market. If a stock has a high Beta, it means its price is more volatile—it moves up and down more than the market. A low Beta means the stock is less volatile and more stable.
Formula for Beta (β):
β = Cov(Ri, Rm) / Var(Rm)
Understanding Alpha (α):
Understanding Beta (β):
How Alpha (α) and Beta (β) Help in Day Trading
The Alpha(α) / Beta(β) Multi-Time Analysis is a tool that helps you figure out how well a stock is doing and how risky it is.
Using Alpha (α) and Beta (β) in Day Trading
In day trading, you should want stocks that not only perform well but also have significant price movements during the day. By picking stocks with an Alpha greater than 0 and a Beta greater than 1.9 (which works well on 5-minute charts), you’re focusing on stocks likely to outperform the market and be highly volatile. This volatility should be great for short-term trading because it offers more chances to profit from quick price changes.
In my studies I’ve found that while high Beta stocks may offer the potential for higher returns, it also comes with a significant amount of risk. I think it would be smart to balance your portfolio with a mix of high and moderate Beta stocks to enjoy high returns while reducing potential losses. On the flip side, focusing on stocks with positive Alpha can give you steady performance. These stocks are less risky and offer consistent returns, making them safer and allowing you to balance your risk.
A good strategy to follow might be to look for stocks with an Alpha greater than 0 and a Beta greater than 1.9 for long positions on a 5-minute chart. These stocks are more likely to move up significantly in the short term.