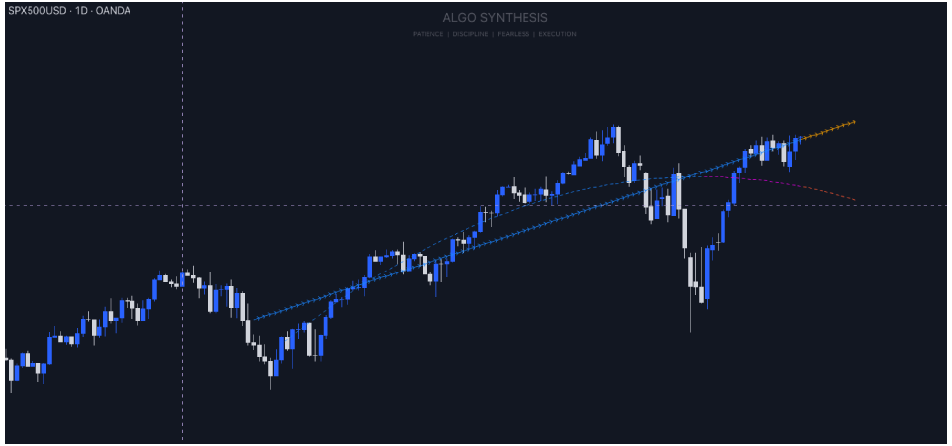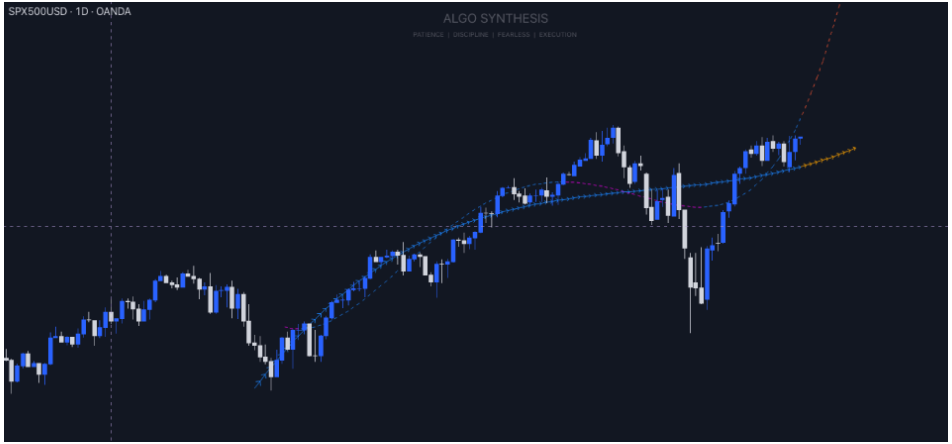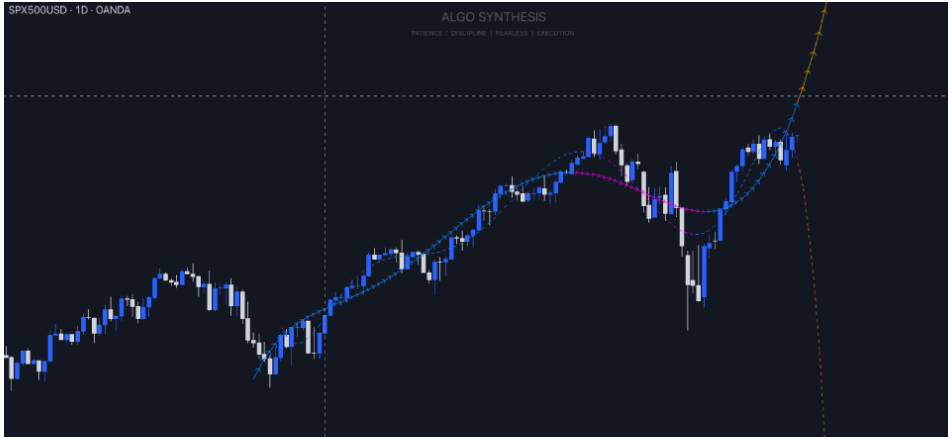


The Dual Polynomial Projection indicator is designed to help predict future price movements on a chart. It uses a mathematical technique called polynomial regression, which allows it to fit a curved line to past price data and then project that line into the future. Simply, it uses past price data to draw lines that show where the price might go next.
What is Polynomial Regression?
It’s a type of statistical method used to model the relationship between a dependent variable (like stock prices) and one or more independent variables (like time). Unlike simple linear regression, which fits a straight line through the data points, polynomial regression fits a curved line. The curve can bend and adjust more freely, making it suitable for capturing more complex patterns that aren't straight.
How It’s Calculated:
Thanks to LuxAlgo for his assistance in explaining this to me.
In polynomial regression, the data is fitted using a ‘polynomial’ equation, which looks something like this:
y=a0+a1x+a2x2+…+anxn
Here, y represents the predicted price, x represents the independent variable (like time), and a0+a1x+a2 are the coefficients that determine the curve’s shape. The term n represents the degree of the polynomial, which controls how flexible the curve is. Higher degrees mean more bends in the curve.
The calculation involves setting up a "design matrix" of the input values (like the past prices), and then solving for the coefficients that minimize the difference between the curve and the actual data points.
What Does Overfitting Mean in Polynomial Regression?
Overfitting happens when the regression curve tries too hard to fit every data point perfectly. Imagine drawing a line that twists and turns to touch every single point on a scatter plot—this might look great for specific data but will likely perform poorly when predicting new, unseen data. Overfitting means the model is too complex and picks up noise (random fluctuations) rather than the true underlying trend.
Effects of Overfitting:
One way to manage overfitting is by controlling the degree of the polynomial. Keeping the degree too high can result in overfitting, while a lower degree might not capture enough of the trend.
How Does the Indicator Work?
The Dual Polynomial Projection indicator doesn’t just use one polynomial regression—it uses two, each slightly different, to provide a more comprehensive look at potential future price movements. Here’s how it does this:
Why Use Two Projections Instead of One?
Using two projections helps provide a broader perspective. If both projections show similar trends, it can confirm the strength of the prediction. However, if the two lines diverge significantly, it might indicate uncertainty or a potential change in the trend.
Reading the Projections: