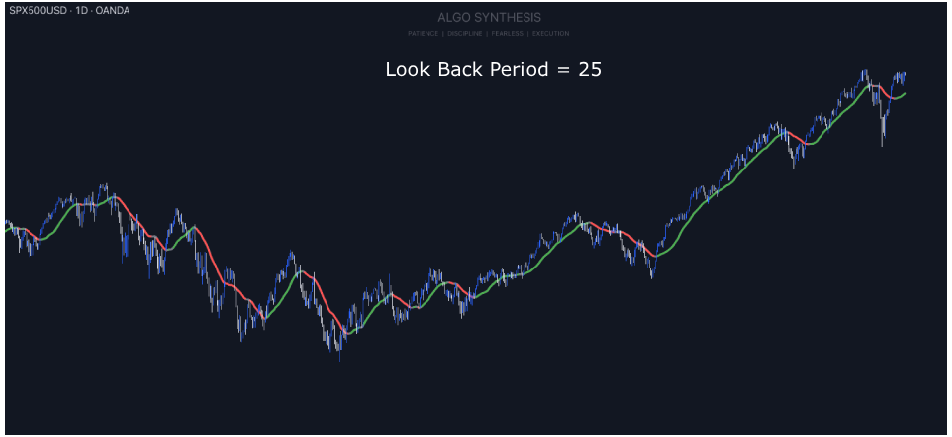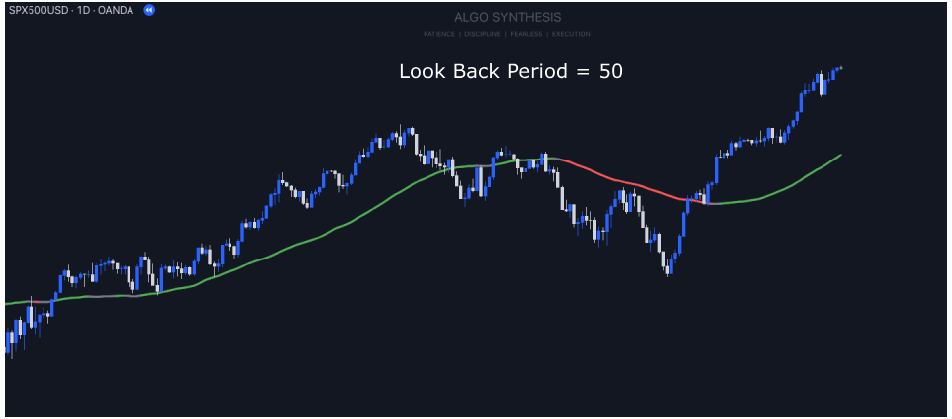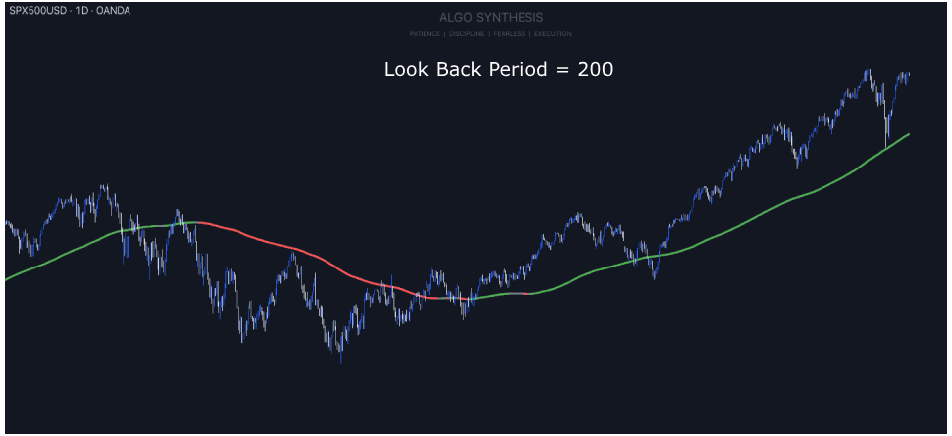


The Refined Time Series Analysis indicator analyzes price movements over time using a linear regression. It helps in identifying and confirming trends and highlighting potential trade areas. By combining linear regression with time series analysis, this indicator provides a visual representation of price movements.
What is Linear Regression?
Linear regression helps to understand the relationship between two variables by fitting a straight line through the data points. In finance, these variables are usually time (on the x-axis) and price (on the y-axis). The line that is fitted is called the “regression line,” and it represents the average relationship between time and price. Linear regression helps predict future prices based on the past performance of the asset.
How Linear Regression is Calculated:
This equation calculates the predicted price (y) at any given time based on the slope and intercept.
What is Time Series Analysis?
Time series analysis involves studying data points collected or recorded at specific time intervals. In financial markets, time series analysis helps understand patterns like trends, cycles, and seasonal variations in prices.
How It Works with Linear Regression:
Linear regression is a key part of time series analysis because it helps establish a trend line that reflects the general direction of prices over time. It smooths out the random noise of daily price fluctuations and highlights the underlying trend. This trend line can then be used to detect deviations (e.g., sudden spikes or drops) which might signal potential trading opportunities.
How the Refined Time Series Analysis Indicator Works
The indicator allows you to adjust settings like the lookback period (how many past bars it considers), whether to calculate manually, and how many hours ahead it should predict. These inputs help tailor the analysis to specific trading needs and market conditions.
It then gathers data from the closing prices of the asset and calculates averages over the specified lookback period. It computes sums of time, price, and their products, which are essential for determining the regression line’s slope and intercept.
Then plots the regression line on the chart, showing the average trend of the prices. If the slope is positive, prices are generally rising, and if negative, they are falling.
Using 2 Time-Series Analysis Indicators
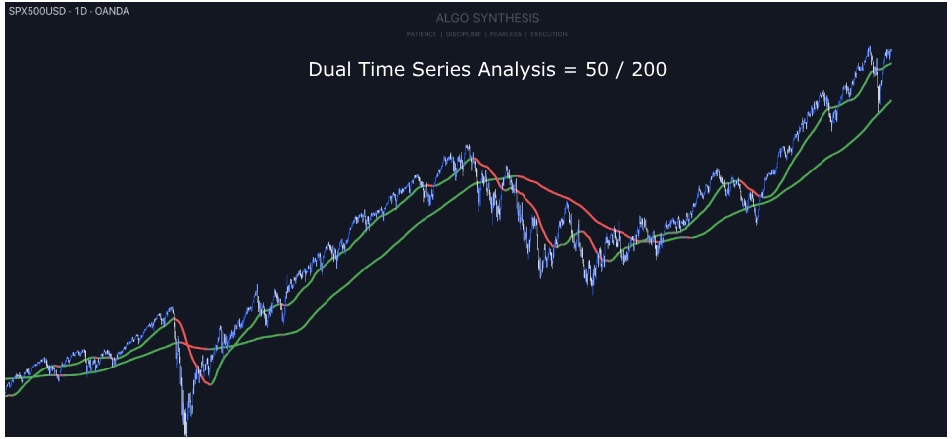
Using two Refined Time Series Analysis lines with different lookback periods, such as 50 and 200, combines short-term and long-term perspectives that may provide a clearer view of market trends. The short-term line (50) is more sensitive to recent price movements, capturing quick shifts and offering early signals for entry and exit points. In contrast, the long-term line (200) smooths out market noise, highlighting the overall trend and helping traders filter out false signals from short-term fluctuations. When the short-term line crosses the long-term line, it could indicate potential trend changes.
The interaction between these lines also may help visualize market momentum and trend strength. A wide gap between the lines suggests strong momentum, while a narrowing gap indicates weakening trends. This dual approach could aid in timing trades by confirming that short-term movements align with the broader market direction.